matplotlib
centos/ubuntu linux 下 python matplotlib 绘图中文标题乱码 解决
Linux • 李魔佛 发表了文章 • 0 个评论 • 3064 次浏览 • 2022-04-15 22:23
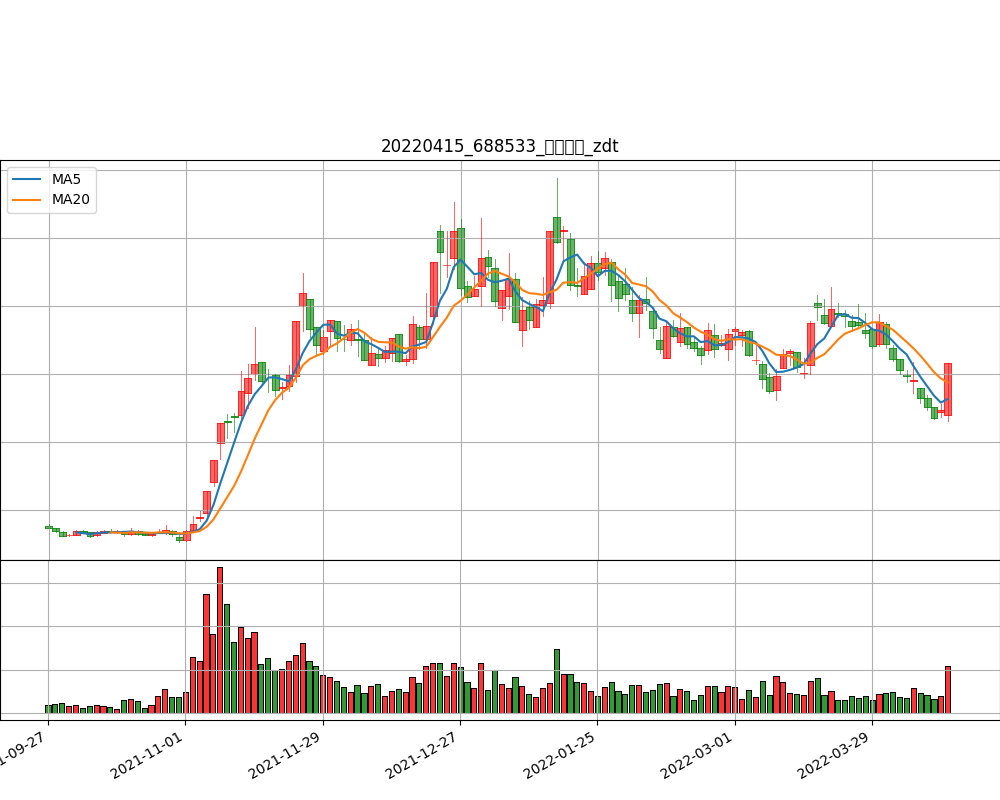
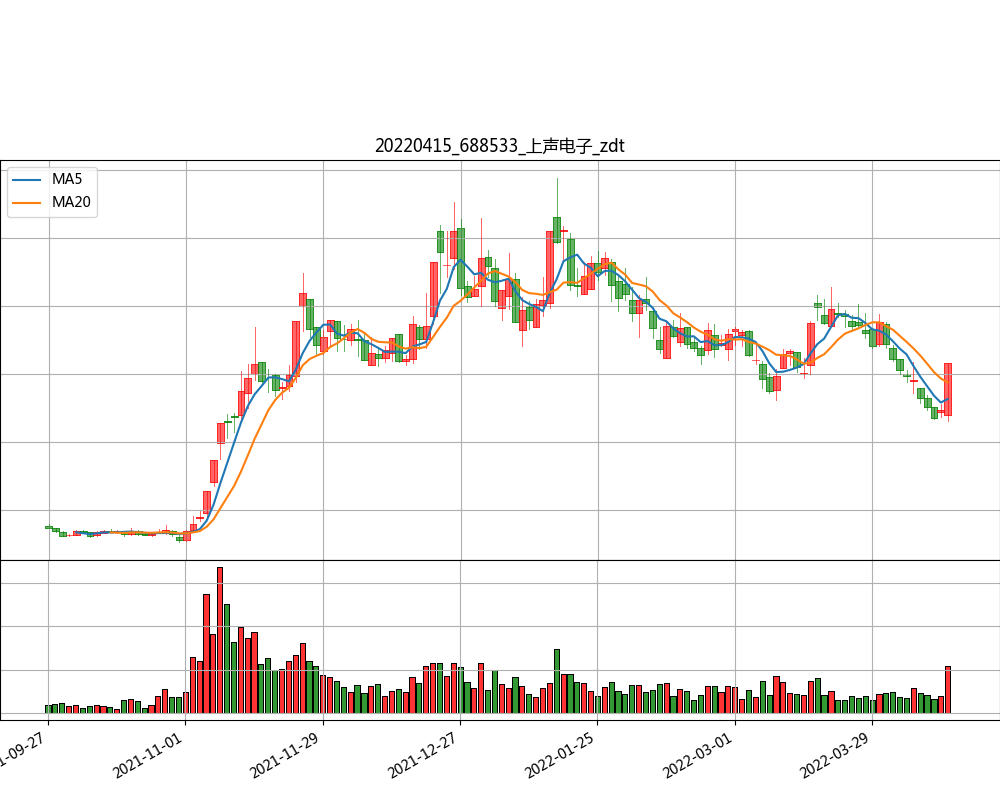
出现下图的错误:
测试代码:import matplotlib as mpl
import matplotlib.pyplot as plt
from matplotlib import rcParams
plt.rcParams['font.family'] = 'sans-serif'
plt.rcParams['font.sans-serif'] = ['simhei'] # 指定默认字体
plt.rcParams['axes.unicode_minus'] = False
plt.title(r'宋体 Times New Roman')
plt.axis('off')
plt.savefig('usestix.png')
每次换机器都遇到这个问题,所以记录下来,以免日后又在折腾
首先找到一个ttf格式的中文字体,windows系统的可以在C盘的system里面找找。
我用的是微软雅黑。msyh.ttf , 需要的可以到公众号里面取。 后台回复: msyh.ttf 即可
或者simhei.ttfcd /usr/share/fonts/
sudo mkdir chinese
sudo cp simhei.ttf /usr/share/fonts/chinese/
sudo chmod -R 755 /usr/share/fonts/chinese
更新缓存mkfontscale
mkfontdir
fc-cache
注意,如果你的系统没有上述命令,需要使用yum install mkfontscale mkfontdir c-cache安装
然后接下来这一步,很重要。
清理缓存,不然不会生效!!!!rm -rf ~/.cache/matplotlib
matplotlib:
同时把这个msyh.ttf的文件复制到matplotlib库下的文件夹:
~python3.9/site-packages/matplotlib/mpl-data/fonts/ttf/
下面
然后运行程序,搞定~
公众号:可转债量化分析
后台回复 : msyh.ttf 或者 simhei.ttf 即可获取字体文件。 查看全部
出现下图的错误:
测试代码:
每次换机器都遇到这个问题,所以记录下来,以免日后又在折腾
首先找到一个ttf格式的中文字体,windows系统的可以在C盘的system里面找找。
我用的是微软雅黑。msyh.ttf , 需要的可以到公众号里面取。 后台回复: msyh.ttf 即可
或者simhei.ttf
更新缓存
注意,如果你的系统没有上述命令,需要使用yum install mkfontscale mkfontdir c-cache安装
然后接下来这一步,很重要。
清理缓存,不然不会生效!!!!
matplotlib:
同时把这个msyh.ttf的文件复制到matplotlib库下的文件夹:
~python3.9/site-packages/matplotlib/mpl-data/fonts/ttf/
下面
然后运行程序,搞定~
公众号:可转债量化分析

后台回复 : msyh.ttf 或者 simhei.ttf 即可获取字体文件。
测试代码:
import matplotlib as mpl

import matplotlib.pyplot as plt

from matplotlib import rcParams


plt.rcParams['font.family'] = 'sans-serif'

plt.rcParams['font.sans-serif'] = ['simhei'] # 指定默认字体

plt.rcParams['axes.unicode_minus'] = False


plt.title(r'宋体 Times New Roman')

plt.axis('off')

plt.savefig('usestix.png')
每次换机器都遇到这个问题,所以记录下来,以免日后又在折腾
首先找到一个ttf格式的中文字体,windows系统的可以在C盘的system里面找找。
我用的是微软雅黑。msyh.ttf , 需要的可以到公众号里面取。 后台回复: msyh.ttf 即可
或者simhei.ttf
cd /usr/share/fonts/

sudo mkdir chinese

sudo cp simhei.ttf /usr/share/fonts/chinese/

sudo chmod -R 755 /usr/share/fonts/chinese
更新缓存
mkfontscale

mkfontdir

fc-cache
注意,如果你的系统没有上述命令,需要使用yum install mkfontscale mkfontdir c-cache安装
然后接下来这一步,很重要。
清理缓存,不然不会生效!!!!
rm -rf ~/.cache/matplotlib
matplotlib:
同时把这个msyh.ttf的文件复制到matplotlib库下的文件夹:
~python3.9/site-packages/matplotlib/mpl-data/fonts/ttf/
下面
然后运行程序,搞定~
公众号:可转债量化分析

后台回复 : msyh.ttf 或者 simhei.ttf 即可获取字体文件。
python安装mpl_finance [finance模块已经从matplotlib2.0.2中脱离出来]
python • 李魔佛 发表了文章 • 0 个评论 • 20119 次浏览 • 2018-04-23 23:17
最新的matplotlib中已经把其中的finance库脱离出来,目前还没有放入PIP的仓库中,所以使用pip install mpl_finance会提示找不到所需要的库.
解决办法:
到官方github中下载源码,然后在本地安装即可。 目前的mpl_finance的版本还是dev版,不过用起来也没什么大问题。
git clone git@github.com:matplotlib/mpl_finance.git
等待下载后,进入该目录, sudo python setup.py install
OK
查看全部
解决办法:
到官方github中下载源码,然后在本地安装即可。 目前的mpl_finance的版本还是dev版,不过用起来也没什么大问题。
git clone git@github.com:matplotlib/mpl_finance.git
等待下载后,进入该目录, sudo python setup.py install
OK
查看全部
最新的matplotlib中已经把其中的finance库脱离出来,目前还没有放入PIP的仓库中,所以使用pip install mpl_finance会提示找不到所需要的库.
解决办法:
到官方github中下载源码,然后在本地安装即可。 目前的mpl_finance的版本还是dev版,不过用起来也没什么大问题。
git clone git@github.com:matplotlib/mpl_finance.git
等待下载后,进入该目录, sudo python setup.py install
OK
解决办法:
到官方github中下载源码,然后在本地安装即可。 目前的mpl_finance的版本还是dev版,不过用起来也没什么大问题。
git clone git@github.com:matplotlib/mpl_finance.git
等待下载后,进入该目录, sudo python setup.py install
OK
python matplotlib 中的plot legend的用法
python • 李魔佛 发表了文章 • 0 个评论 • 24439 次浏览 • 2017-07-13 11:59
官方有链接说明:https://matplotlib.org/users/legend_guide.html
不过对于大部分人来说,英文教程,加上上面的例子有点晦涩。
所以以个人的理解,简单地用代码介绍下。 import matplotlib.pyplot as plt
import numpy as np
x = np.arange(10)
print x
fig = plt.figure()
ax = plt.subplot(111)
for i in xrange(5):
#ax.plot(x, i * x, label='y=%dx' %i)
ax.plot(x, i * x, label='$y = %ix$' % i)
ax.legend()
plt.show()
运行上面的代码后,得到的结果是:
如果把那句legend() 的语句去掉,那么图形上的图例也就会消失了。
所以legend()的主要只用就是用于在图上标明一个图例,用于说明每条曲线的文字显示。 你也可以把图例控制在左边,右边,底下等等。
实际使用中,legend()有一个loc参数,用于控制图例的位置。 比如 plot.legend(loc=2) , 这个位置就是4象项中的第二象项,也就是左上角。 loc可以为1,2,3,4 这四个数字。
原文连接:
http://30daydo.com/article/215
转载请注明出处 查看全部
官方有链接说明:https://matplotlib.org/users/legend_guide.html
不过对于大部分人来说,英文教程,加上上面的例子有点晦涩。
所以以个人的理解,简单地用代码介绍下。
运行上面的代码后,得到的结果是:
如果把那句legend() 的语句去掉,那么图形上的图例也就会消失了。
所以legend()的主要只用就是用于在图上标明一个图例,用于说明每条曲线的文字显示。 你也可以把图例控制在左边,右边,底下等等。
实际使用中,legend()有一个loc参数,用于控制图例的位置。 比如 plot.legend(loc=2) , 这个位置就是4象项中的第二象项,也就是左上角。 loc可以为1,2,3,4 这四个数字。
原文连接:
http://30daydo.com/article/215
转载请注明出处
不过对于大部分人来说,英文教程,加上上面的例子有点晦涩。
所以以个人的理解,简单地用代码介绍下。
    import matplotlib.pyplot as plt

    import numpy as np


    x = np.arange(10)

    print x

    fig = plt.figure()

    ax = plt.subplot(111)


    for i in xrange(5):

        #ax.plot(x, i * x, label='y=%dx' %i)

        ax.plot(x, i * x, label='$y = %ix$' % i)


    ax.legend()


    plt.show()
运行上面的代码后,得到的结果是:
如果把那句legend() 的语句去掉,那么图形上的图例也就会消失了。
所以legend()的主要只用就是用于在图上标明一个图例,用于说明每条曲线的文字显示。 你也可以把图例控制在左边,右边,底下等等。
实际使用中,legend()有一个loc参数,用于控制图例的位置。 比如 plot.legend(loc=2) , 这个位置就是4象项中的第二象项,也就是左上角。 loc可以为1,2,3,4 这四个数字。
原文连接:
http://30daydo.com/article/215
转载请注明出处
centos/ubuntu linux 下 python matplotlib 绘图中文标题乱码 解决
Linux • 李魔佛 发表了文章 • 0 个评论 • 3064 次浏览 • 2022-04-15 22:23
出现下图的错误:
测试代码:import matplotlib as mpl
import matplotlib.pyplot as plt
from matplotlib import rcParams
plt.rcParams['font.family'] = 'sans-serif'
plt.rcParams['font.sans-serif'] = ['simhei'] # 指定默认字体
plt.rcParams['axes.unicode_minus'] = False
plt.title(r'宋体 Times New Roman')
plt.axis('off')
plt.savefig('usestix.png')
每次换机器都遇到这个问题,所以记录下来,以免日后又在折腾
首先找到一个ttf格式的中文字体,windows系统的可以在C盘的system里面找找。
我用的是微软雅黑。msyh.ttf , 需要的可以到公众号里面取。 后台回复: msyh.ttf 即可
或者simhei.ttfcd /usr/share/fonts/
sudo mkdir chinese
sudo cp simhei.ttf /usr/share/fonts/chinese/
sudo chmod -R 755 /usr/share/fonts/chinese
更新缓存mkfontscale
mkfontdir
fc-cache
注意,如果你的系统没有上述命令,需要使用yum install mkfontscale mkfontdir c-cache安装
然后接下来这一步,很重要。
清理缓存,不然不会生效!!!!rm -rf ~/.cache/matplotlib
matplotlib:
同时把这个msyh.ttf的文件复制到matplotlib库下的文件夹:
~python3.9/site-packages/matplotlib/mpl-data/fonts/ttf/
下面
然后运行程序,搞定~
公众号:可转债量化分析
后台回复 : msyh.ttf 或者 simhei.ttf 即可获取字体文件。 查看全部
测试代码:import matplotlib as mpl
import matplotlib.pyplot as plt
from matplotlib import rcParams
plt.rcParams['font.family'] = 'sans-serif'
plt.rcParams['font.sans-serif'] = ['simhei'] # 指定默认字体
plt.rcParams['axes.unicode_minus'] = False
plt.title(r'宋体 Times New Roman')
plt.axis('off')
plt.savefig('usestix.png')
每次换机器都遇到这个问题,所以记录下来,以免日后又在折腾
首先找到一个ttf格式的中文字体,windows系统的可以在C盘的system里面找找。
我用的是微软雅黑。msyh.ttf , 需要的可以到公众号里面取。 后台回复: msyh.ttf 即可
或者simhei.ttfcd /usr/share/fonts/
sudo mkdir chinese
sudo cp simhei.ttf /usr/share/fonts/chinese/
sudo chmod -R 755 /usr/share/fonts/chinese
更新缓存mkfontscale
mkfontdir
fc-cache
注意,如果你的系统没有上述命令,需要使用yum install mkfontscale mkfontdir c-cache安装
然后接下来这一步,很重要。
清理缓存,不然不会生效!!!!rm -rf ~/.cache/matplotlib
matplotlib:
同时把这个msyh.ttf的文件复制到matplotlib库下的文件夹:
~python3.9/site-packages/matplotlib/mpl-data/fonts/ttf/
下面
然后运行程序,搞定~
公众号:可转债量化分析
后台回复 : msyh.ttf 或者 simhei.ttf 即可获取字体文件。 查看全部
出现下图的错误:
测试代码:
每次换机器都遇到这个问题,所以记录下来,以免日后又在折腾
首先找到一个ttf格式的中文字体,windows系统的可以在C盘的system里面找找。
我用的是微软雅黑。msyh.ttf , 需要的可以到公众号里面取。 后台回复: msyh.ttf 即可
或者simhei.ttf
更新缓存
注意,如果你的系统没有上述命令,需要使用yum install mkfontscale mkfontdir c-cache安装
然后接下来这一步,很重要。
清理缓存,不然不会生效!!!!
matplotlib:
同时把这个msyh.ttf的文件复制到matplotlib库下的文件夹:
~python3.9/site-packages/matplotlib/mpl-data/fonts/ttf/
下面
然后运行程序,搞定~
公众号:可转债量化分析

后台回复 : msyh.ttf 或者 simhei.ttf 即可获取字体文件。
测试代码:
import matplotlib as mpl

import matplotlib.pyplot as plt

from matplotlib import rcParams


plt.rcParams['font.family'] = 'sans-serif'

plt.rcParams['font.sans-serif'] = ['simhei'] # 指定默认字体

plt.rcParams['axes.unicode_minus'] = False


plt.title(r'宋体 Times New Roman')

plt.axis('off')

plt.savefig('usestix.png')
每次换机器都遇到这个问题,所以记录下来,以免日后又在折腾
首先找到一个ttf格式的中文字体,windows系统的可以在C盘的system里面找找。
我用的是微软雅黑。msyh.ttf , 需要的可以到公众号里面取。 后台回复: msyh.ttf 即可
或者simhei.ttf
cd /usr/share/fonts/

sudo mkdir chinese

sudo cp simhei.ttf /usr/share/fonts/chinese/

sudo chmod -R 755 /usr/share/fonts/chinese
更新缓存
mkfontscale

mkfontdir

fc-cache
注意,如果你的系统没有上述命令,需要使用yum install mkfontscale mkfontdir c-cache安装
然后接下来这一步,很重要。
清理缓存,不然不会生效!!!!
rm -rf ~/.cache/matplotlib
matplotlib:
同时把这个msyh.ttf的文件复制到matplotlib库下的文件夹:
~python3.9/site-packages/matplotlib/mpl-data/fonts/ttf/
下面
然后运行程序,搞定~
公众号:可转债量化分析

后台回复 : msyh.ttf 或者 simhei.ttf 即可获取字体文件。
python安装mpl_finance [finance模块已经从matplotlib2.0.2中脱离出来]
python • 李魔佛 发表了文章 • 0 个评论 • 20119 次浏览 • 2018-04-23 23:17
最新的matplotlib中已经把其中的finance库脱离出来,目前还没有放入PIP的仓库中,所以使用pip install mpl_finance会提示找不到所需要的库.
解决办法:
到官方github中下载源码,然后在本地安装即可。 目前的mpl_finance的版本还是dev版,不过用起来也没什么大问题。
git clone git@github.com:matplotlib/mpl_finance.git
等待下载后,进入该目录, sudo python setup.py install
OK
查看全部
解决办法:
到官方github中下载源码,然后在本地安装即可。 目前的mpl_finance的版本还是dev版,不过用起来也没什么大问题。
git clone git@github.com:matplotlib/mpl_finance.git
等待下载后,进入该目录, sudo python setup.py install
OK
查看全部
最新的matplotlib中已经把其中的finance库脱离出来,目前还没有放入PIP的仓库中,所以使用pip install mpl_finance会提示找不到所需要的库.
解决办法:
到官方github中下载源码,然后在本地安装即可。 目前的mpl_finance的版本还是dev版,不过用起来也没什么大问题。
git clone git@github.com:matplotlib/mpl_finance.git
等待下载后,进入该目录, sudo python setup.py install
OK
解决办法:
到官方github中下载源码,然后在本地安装即可。 目前的mpl_finance的版本还是dev版,不过用起来也没什么大问题。
git clone git@github.com:matplotlib/mpl_finance.git
等待下载后,进入该目录, sudo python setup.py install
OK
python matplotlib 中的plot legend的用法
python • 李魔佛 发表了文章 • 0 个评论 • 24439 次浏览 • 2017-07-13 11:59
官方有链接说明:https://matplotlib.org/users/legend_guide.html
不过对于大部分人来说,英文教程,加上上面的例子有点晦涩。
所以以个人的理解,简单地用代码介绍下。 import matplotlib.pyplot as plt
import numpy as np
x = np.arange(10)
print x
fig = plt.figure()
ax = plt.subplot(111)
for i in xrange(5):
#ax.plot(x, i * x, label='y=%dx' %i)
ax.plot(x, i * x, label='$y = %ix$' % i)
ax.legend()
plt.show()
运行上面的代码后,得到的结果是:
如果把那句legend() 的语句去掉,那么图形上的图例也就会消失了。
所以legend()的主要只用就是用于在图上标明一个图例,用于说明每条曲线的文字显示。 你也可以把图例控制在左边,右边,底下等等。
实际使用中,legend()有一个loc参数,用于控制图例的位置。 比如 plot.legend(loc=2) , 这个位置就是4象项中的第二象项,也就是左上角。 loc可以为1,2,3,4 这四个数字。
原文连接:
http://30daydo.com/article/215
转载请注明出处 查看全部
不过对于大部分人来说,英文教程,加上上面的例子有点晦涩。
所以以个人的理解,简单地用代码介绍下。 import matplotlib.pyplot as plt
import numpy as np
x = np.arange(10)
print x
fig = plt.figure()
ax = plt.subplot(111)
for i in xrange(5):
#ax.plot(x, i * x, label='y=%dx' %i)
ax.plot(x, i * x, label='$y = %ix$' % i)
ax.legend()
plt.show()
运行上面的代码后,得到的结果是:
如果把那句legend() 的语句去掉,那么图形上的图例也就会消失了。
所以legend()的主要只用就是用于在图上标明一个图例,用于说明每条曲线的文字显示。 你也可以把图例控制在左边,右边,底下等等。
实际使用中,legend()有一个loc参数,用于控制图例的位置。 比如 plot.legend(loc=2) , 这个位置就是4象项中的第二象项,也就是左上角。 loc可以为1,2,3,4 这四个数字。
原文连接:
http://30daydo.com/article/215
转载请注明出处 查看全部
官方有链接说明:https://matplotlib.org/users/legend_guide.html
不过对于大部分人来说,英文教程,加上上面的例子有点晦涩。
所以以个人的理解,简单地用代码介绍下。
运行上面的代码后,得到的结果是:
如果把那句legend() 的语句去掉,那么图形上的图例也就会消失了。
所以legend()的主要只用就是用于在图上标明一个图例,用于说明每条曲线的文字显示。 你也可以把图例控制在左边,右边,底下等等。
实际使用中,legend()有一个loc参数,用于控制图例的位置。 比如 plot.legend(loc=2) , 这个位置就是4象项中的第二象项,也就是左上角。 loc可以为1,2,3,4 这四个数字。
原文连接:
http://30daydo.com/article/215
转载请注明出处
不过对于大部分人来说,英文教程,加上上面的例子有点晦涩。
所以以个人的理解,简单地用代码介绍下。
    import matplotlib.pyplot as plt

    import numpy as np


    x = np.arange(10)

    print x

    fig = plt.figure()

    ax = plt.subplot(111)


    for i in xrange(5):

        #ax.plot(x, i * x, label='y=%dx' %i)

        ax.plot(x, i * x, label='$y = %ix$' % i)


    ax.legend()


    plt.show()
运行上面的代码后,得到的结果是:
如果把那句legend() 的语句去掉,那么图形上的图例也就会消失了。
所以legend()的主要只用就是用于在图上标明一个图例,用于说明每条曲线的文字显示。 你也可以把图例控制在左边,右边,底下等等。
实际使用中,legend()有一个loc参数,用于控制图例的位置。 比如 plot.legend(loc=2) , 这个位置就是4象项中的第二象项,也就是左上角。 loc可以为1,2,3,4 这四个数字。
原文连接:
http://30daydo.com/article/215
转载请注明出处

